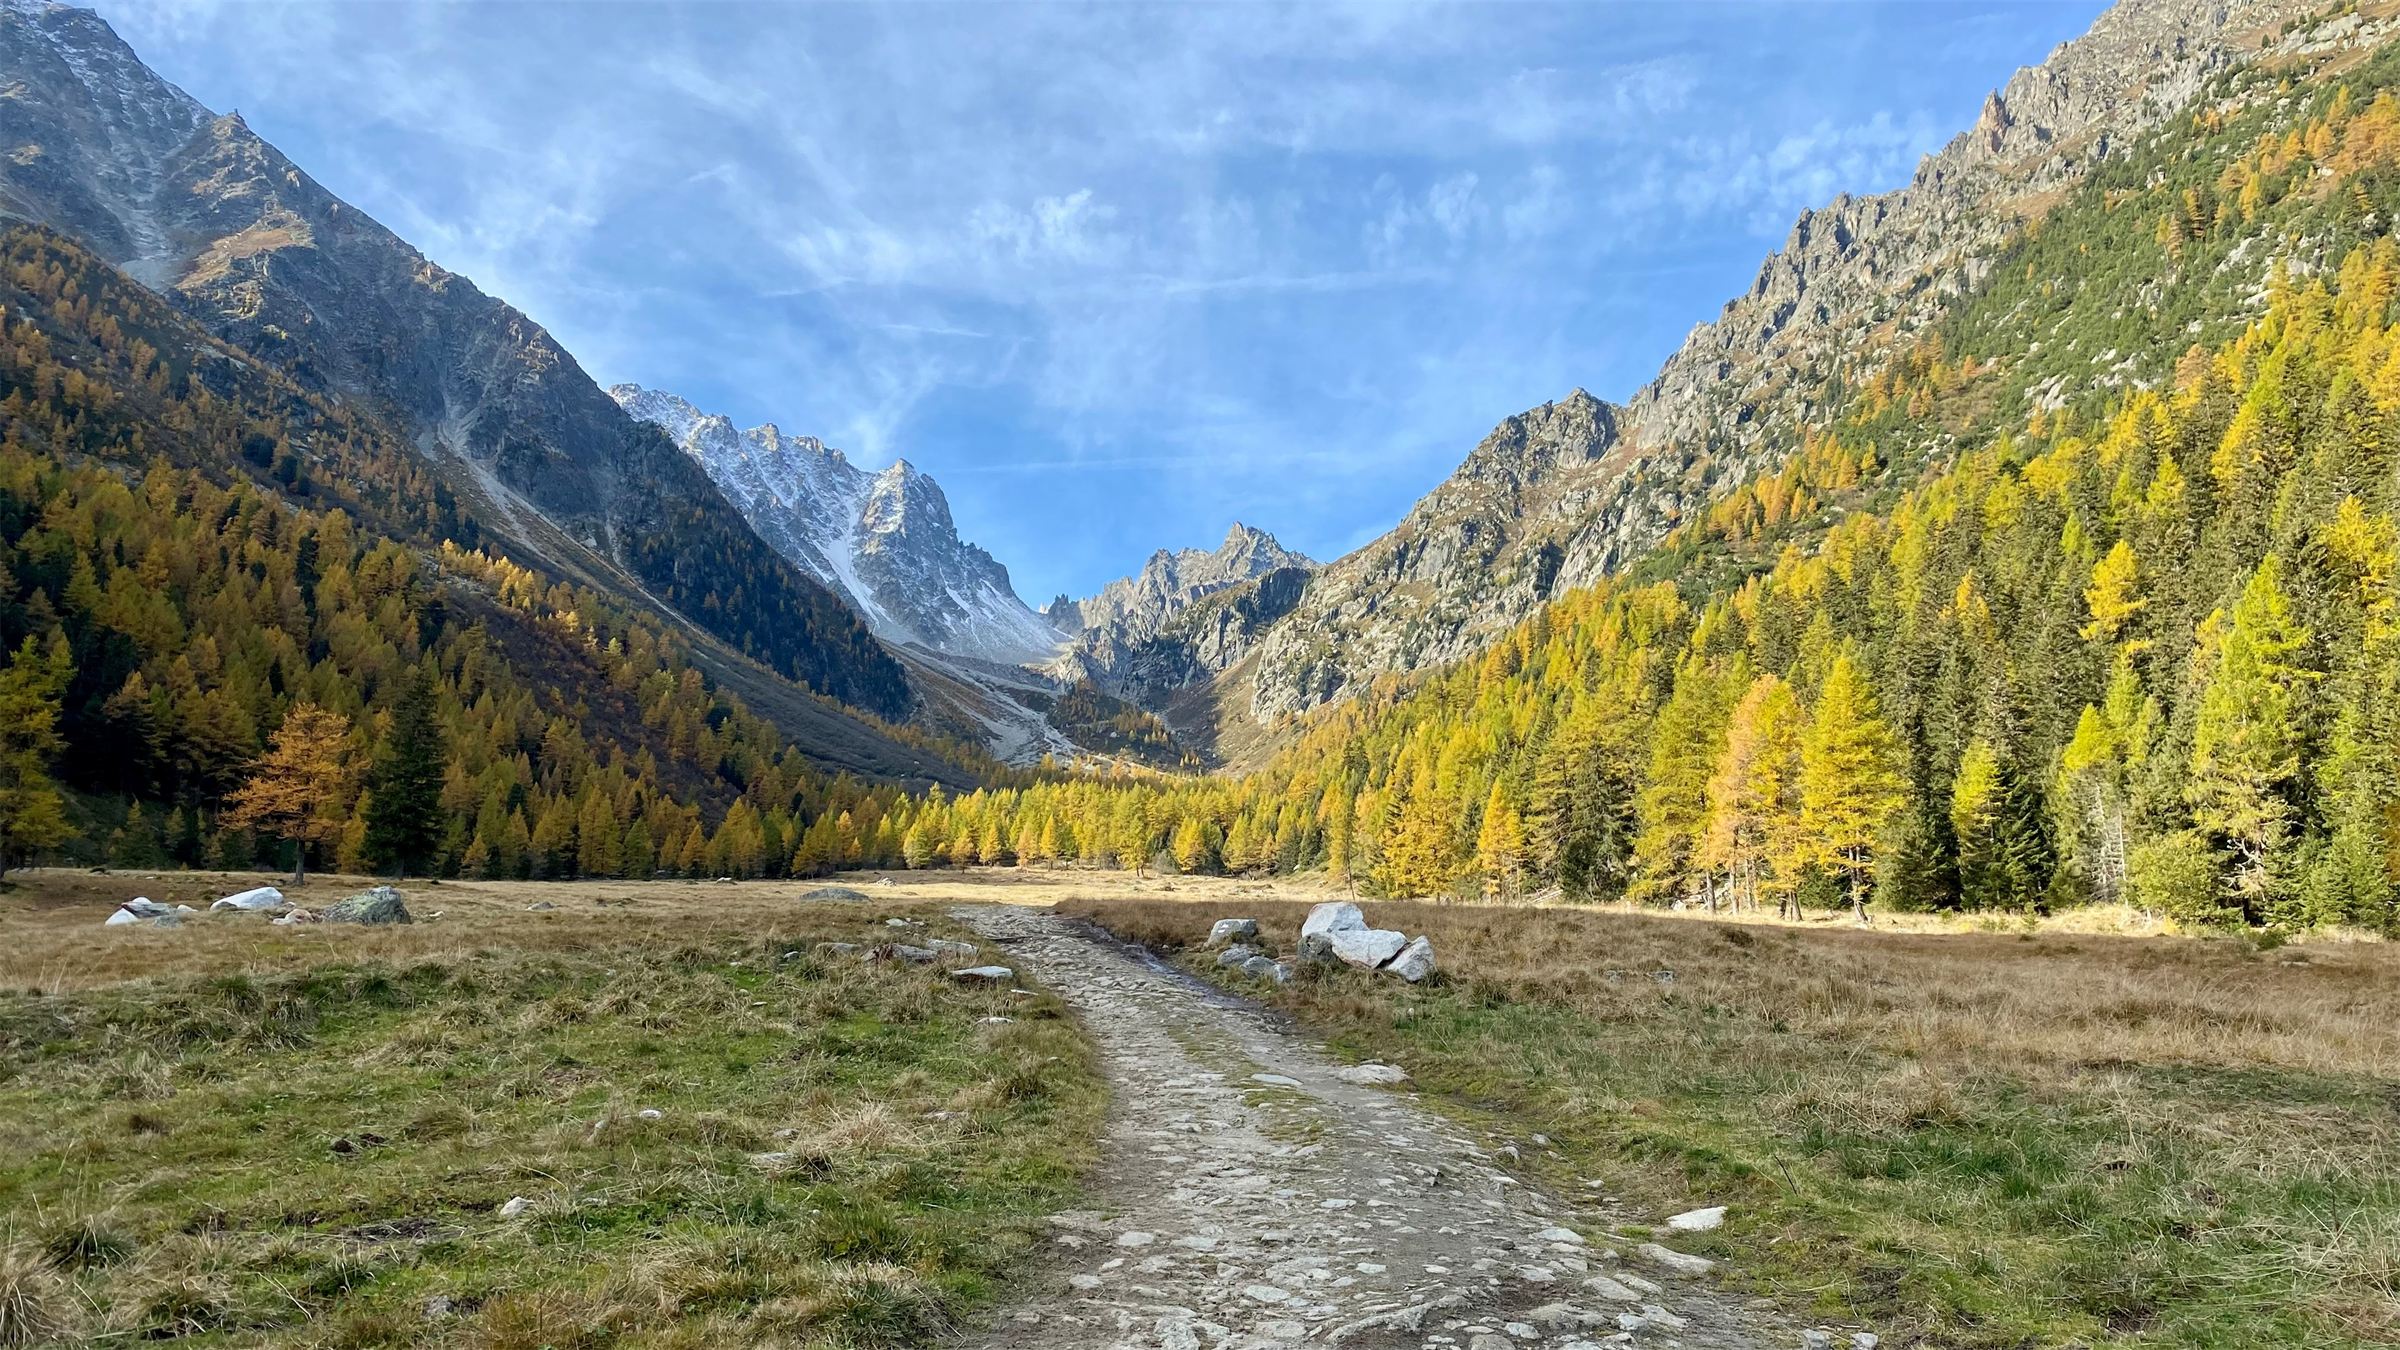
Gravel road leading through open fields towards the hills

Gateway to
Productivity

Two software solutions to plan and execute labour-intensive manufacturing

+13%

Productivity

−60%

Inventory & WIP

−40%

Lead Time

−40%

Quality Issues & Rework

Our solutions

Two software solutions to plan and execute labour intensive manufacturing

Flow Optimizer APS logo

Production scheduling (APS) – Flow Optimizer

  • Master Production Schedule (10 week horizon)
  • Balance demand, capacity & material constraints
  • Bottleneck identification & planning
  • Fast "what-if" scenario simulations
  • Multilevel BOM support
  • Handles large volume orders & resources

Replace manual planning with automated, intelligent scheduling that maximizes capacity utilization

Flow Manager MES logo

Production execution (MES) – Flow Manager

  • Real-time operator guidance on worker devices
  • Paperless production & material tracking
  • Digital quality management & defect tracking
  • Shopfloor visualization dashboards
  • Worker performance analytics & training insights
  • Barcode/QR/NFC license plate tracking

Capture all production data with real-time visibility and immediate quality feedback

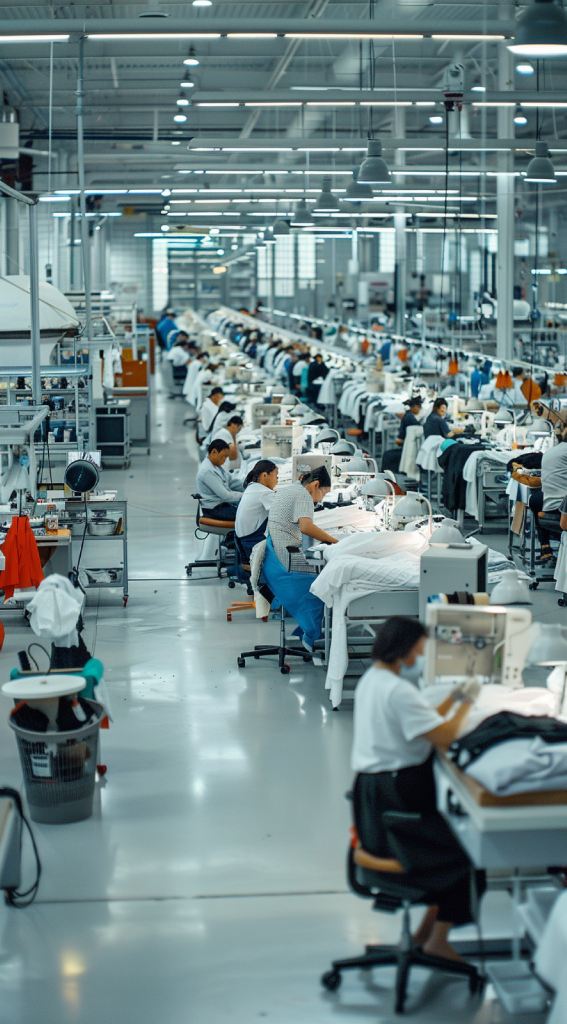
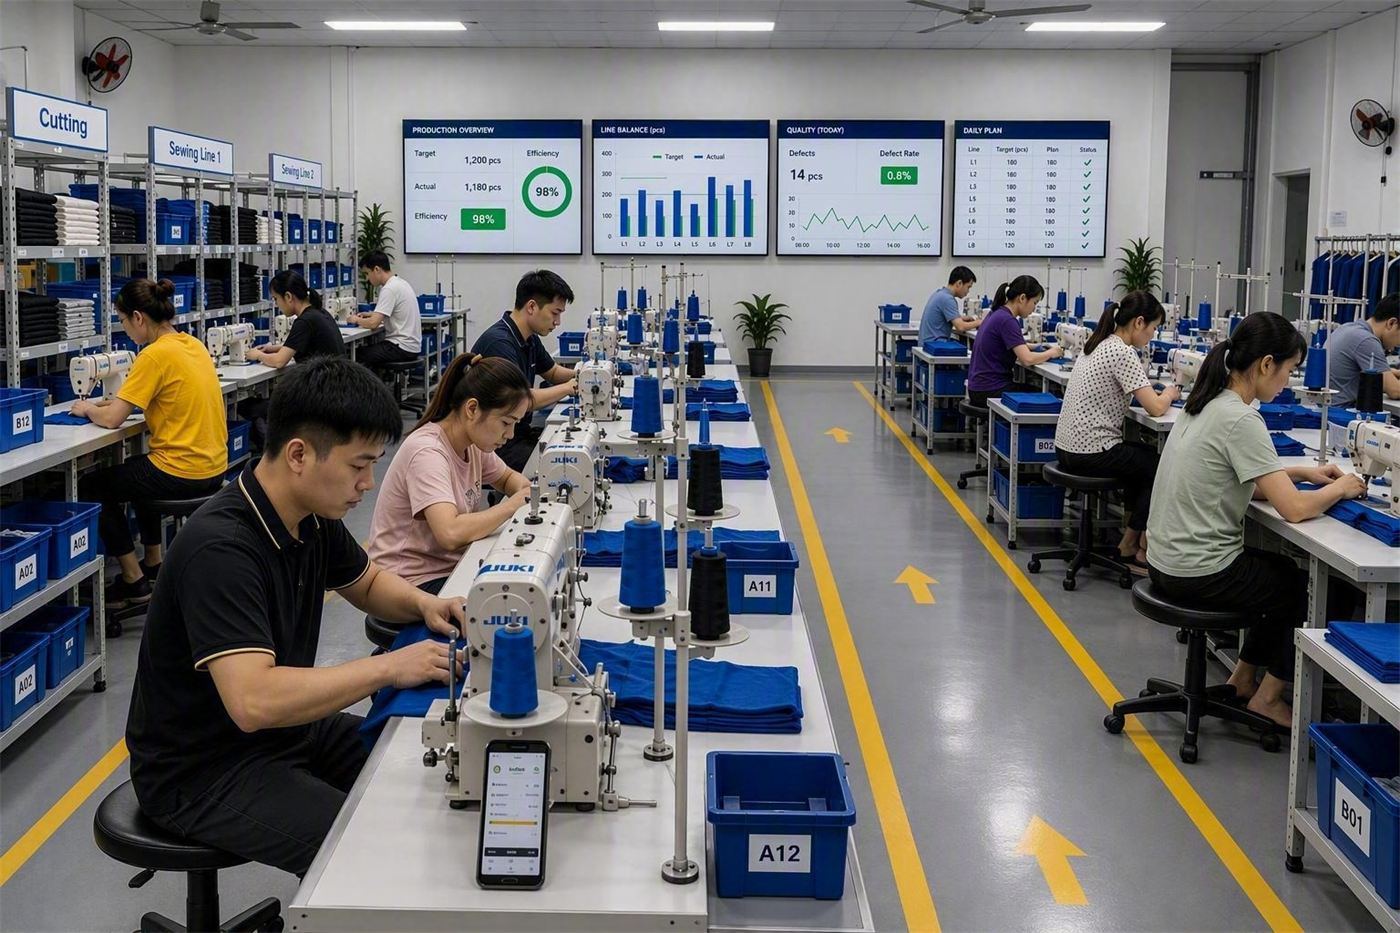
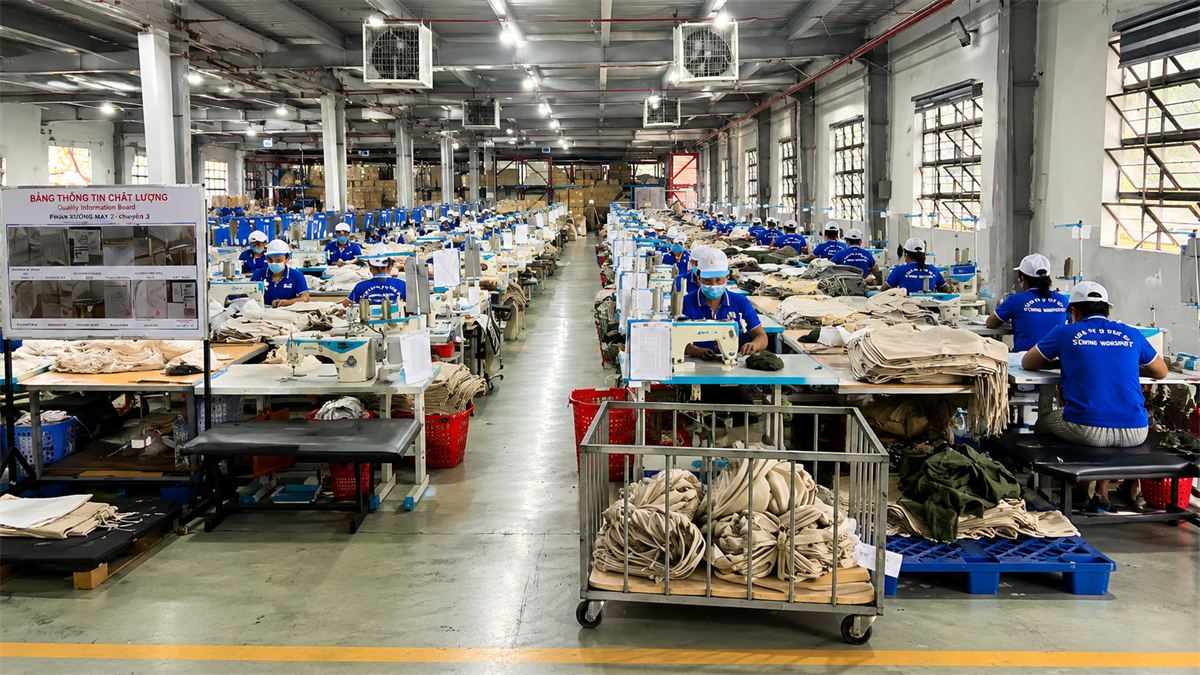
Long rows of sewing workstations in a garment factory
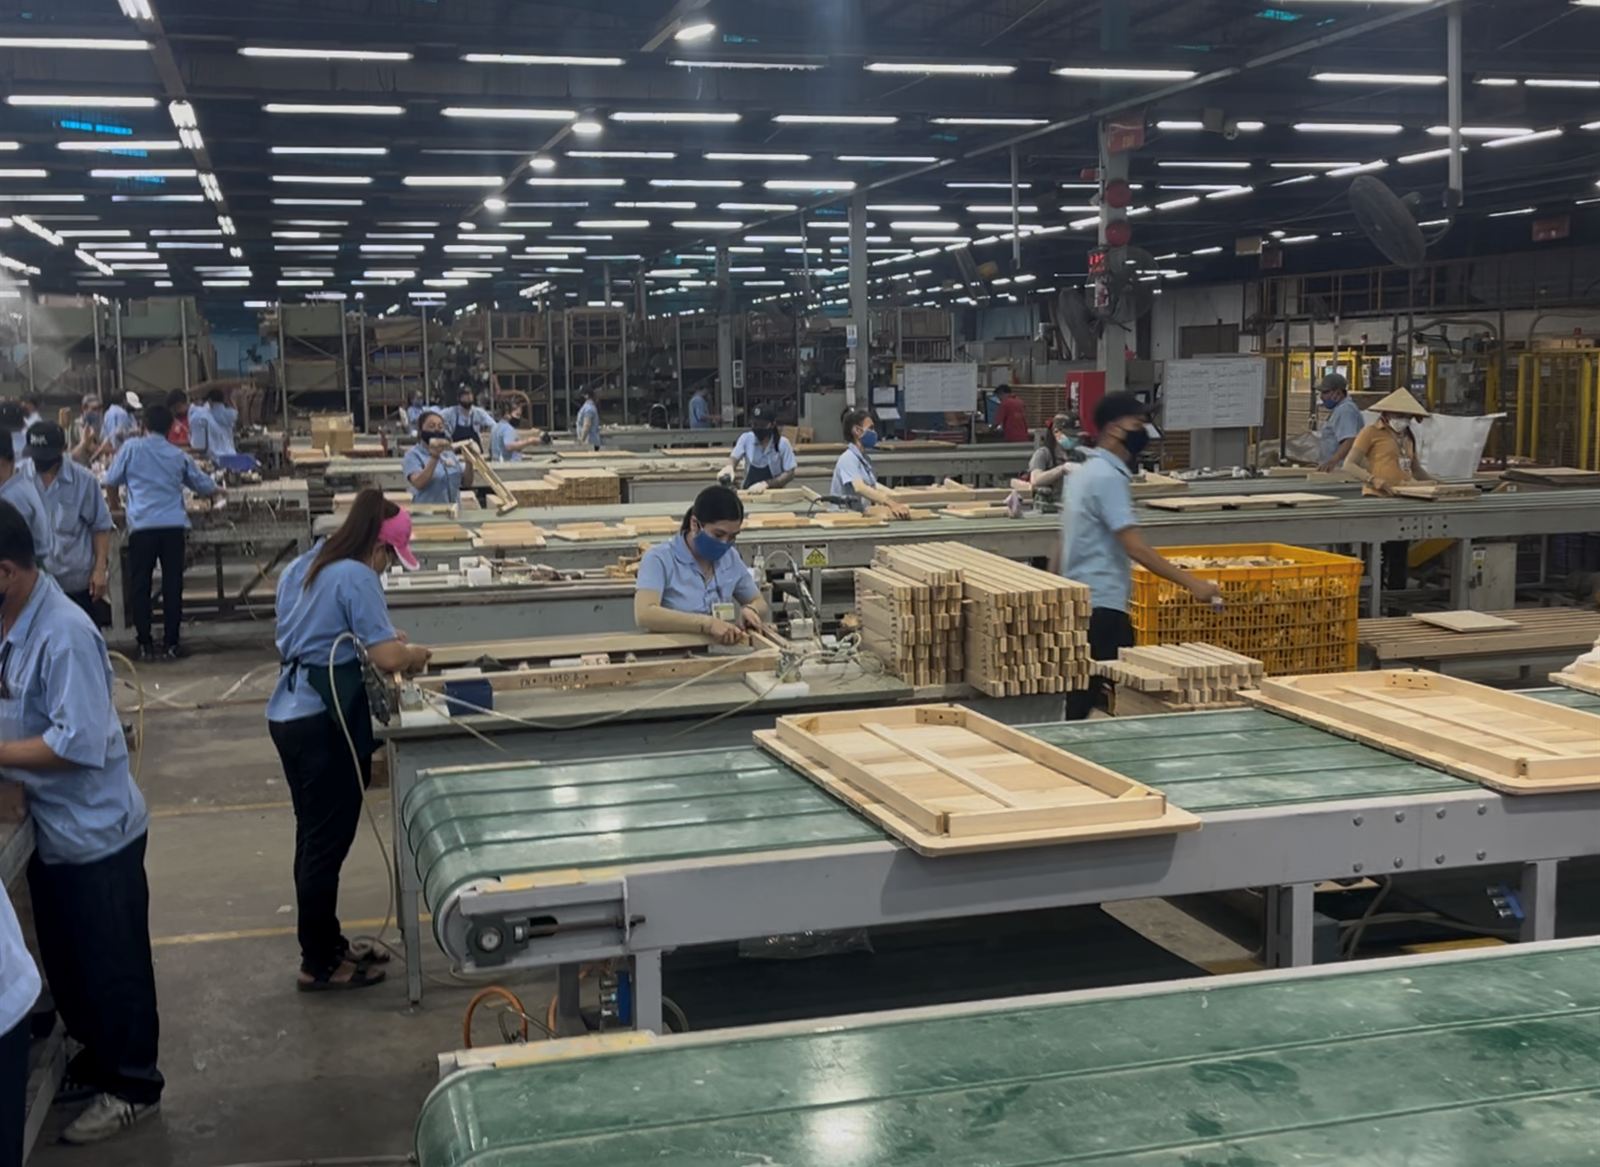
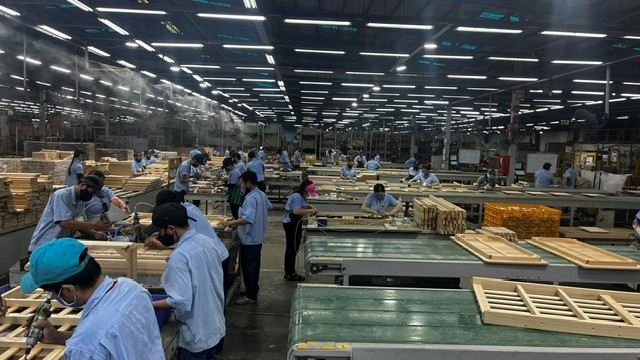
Workers assembling wooden frames along a production line

Expected Results

+13%
BeforeAfter

Improved productivity

(7%–15%)

−60%
BeforeAfter

Reduced inventory & WIP levels

(50%–80%)

−40%
BeforeAfter

Reduced lead time

(25%–50%)

−40%
BeforeAfter

Improved quality & less rework

(25%–50%)

  • Increased customer satisfaction through reliable delivery dates
  • Manage higher complexity without loss (↑ SKU, ↓ order size)
  • Paperless production and operations
  • Easy transition to multiple shifts
  • Enable scale of management (fewer managers per worker, less admin)
  • Increase plant capacity utilization
  • Identify individual training requirements
  • Support better decision-making with data-driven insights

From batch to flow

Before & After

What a shopfloor looks like before and after flow, visual management and digital execution are in place

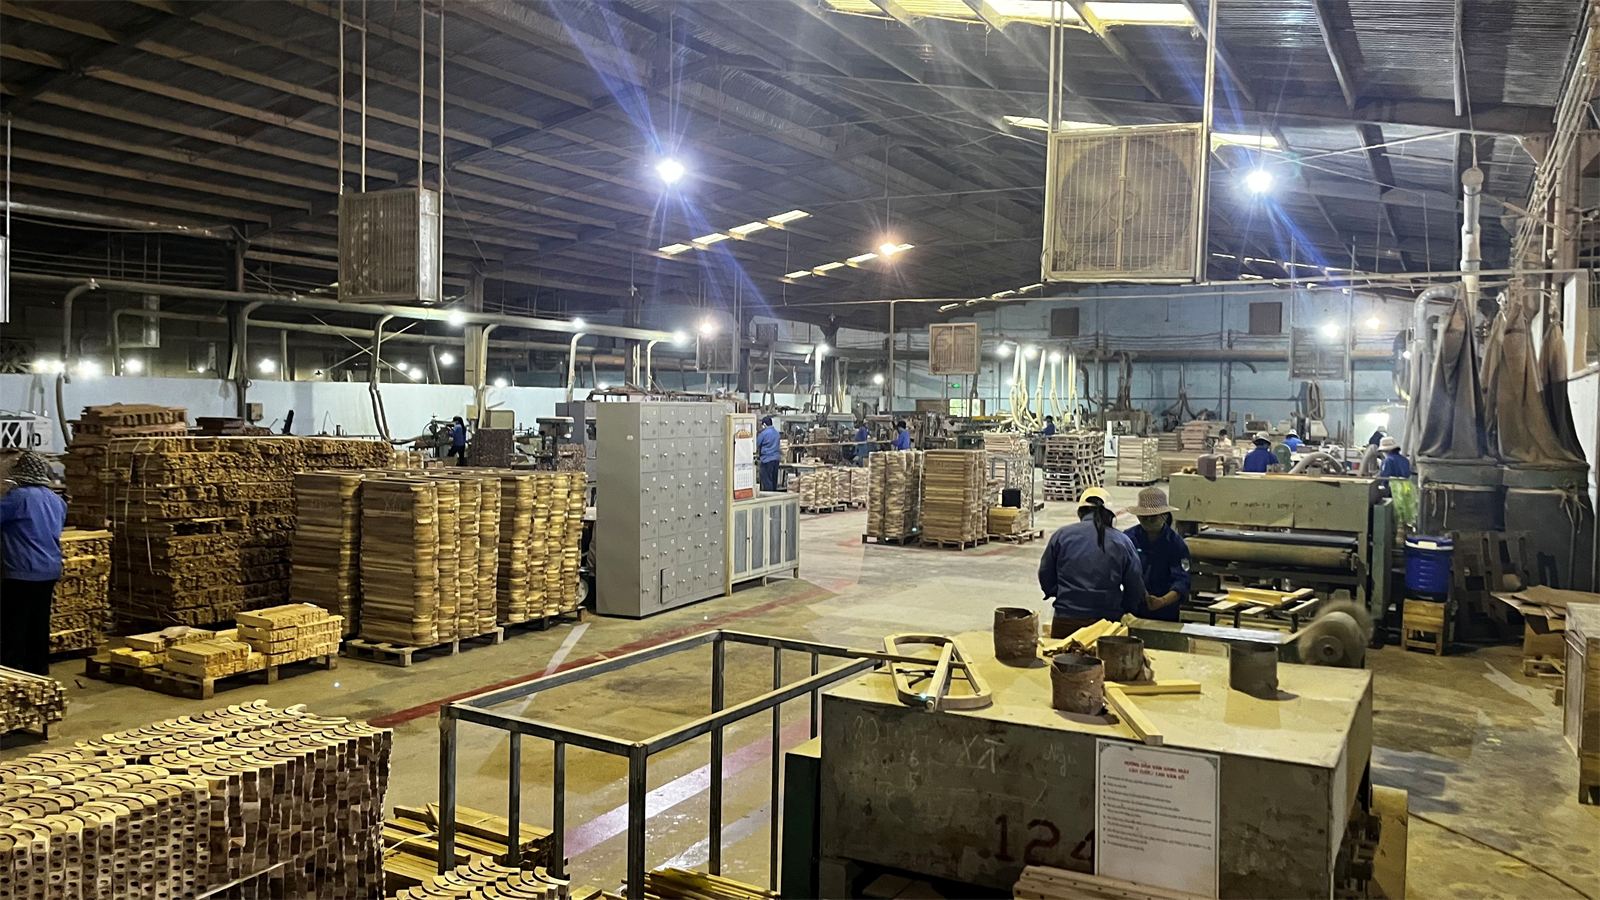
BeforeFactory hall with stacks of wooden parts on pallets and manual handling

Issues observed

  • –Large amounts of WIP and inventory on pallets
  • –Floor space used for storage rather than value creation
  • –Manual movement of materials
  • –Limited visual management – status not visible
  • –Batch production rather than flow production
  • –Paper-based instructions and reporting

Symptoms

  • –High lead times
  • –Quality issues discovered late
  • –Excess inventory
  • –Low visibility of bottlenecks
  • –Difficulty tracking orders
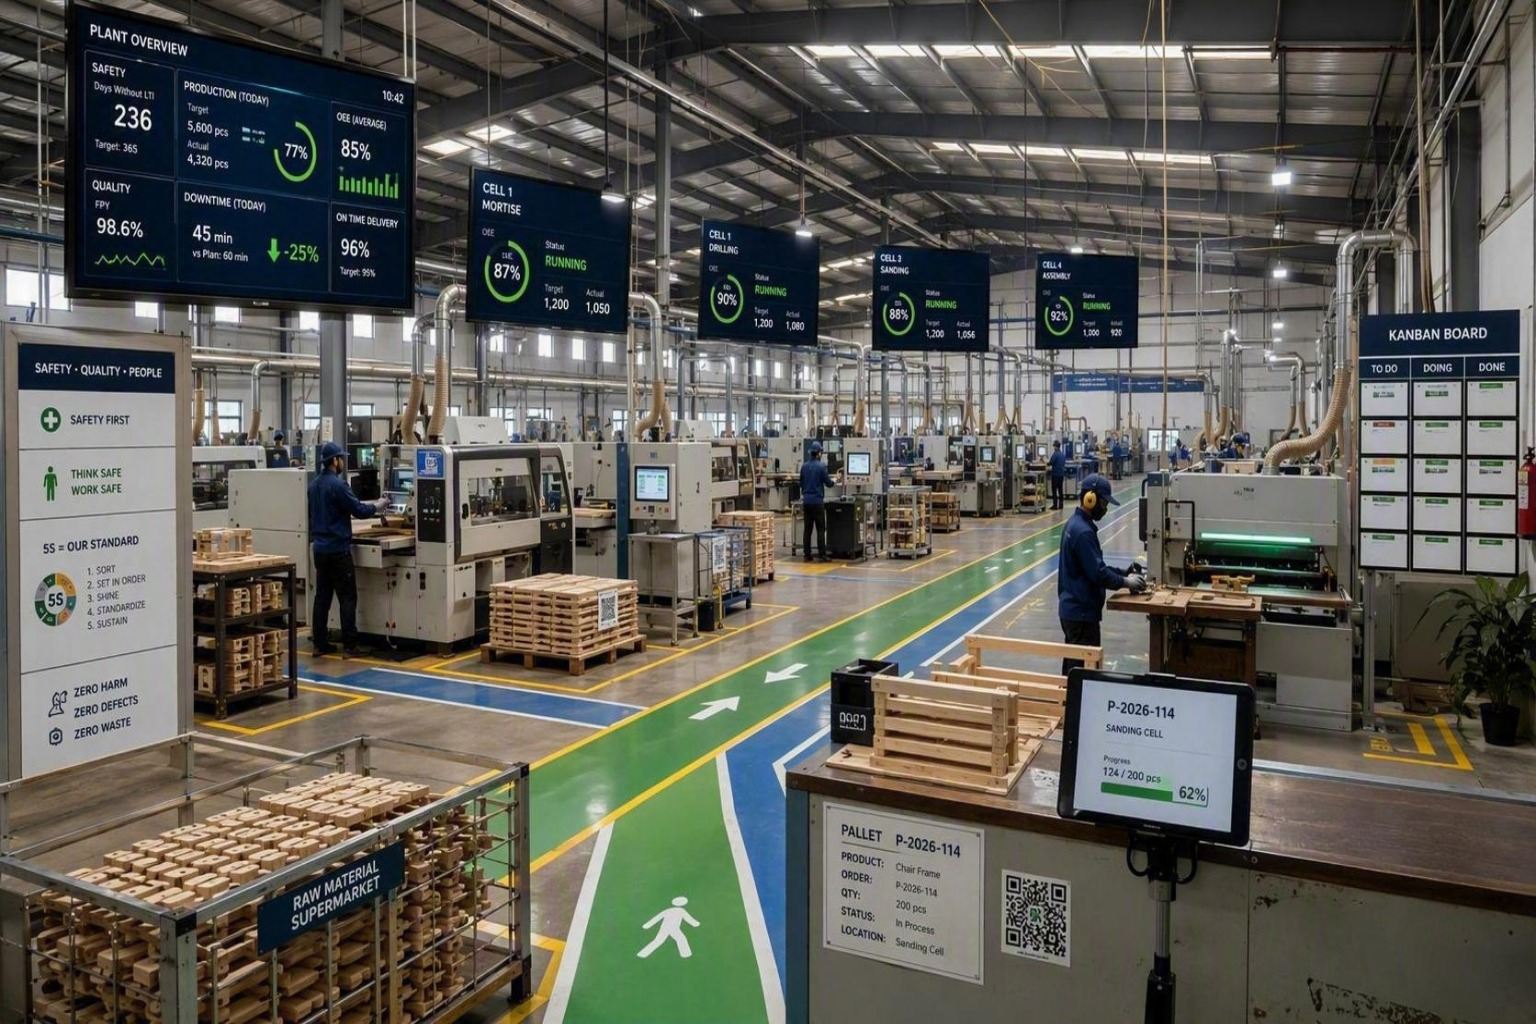
AfterOrganized factory with marked flow lanes and live production dashboards above each cell

Flow layout

  • ✓Reduced pallet stacks
  • ✓Clearly marked flow lanes
  • ✓Machines grouped by product family
  • ✓U-shaped production cells

Mounted screens

  • ✓Current order & production target
  • ✓Actual production & OEE
  • ✓Machine status & downtime reasons
  • ✓Quality alerts

Quality at source

  • ✓Tablet-based inspections
  • ✓Picture-guided work instructions
  • ✓Digital SPC
  • ✓Automatic defect logging

Focus & Values

Hands guiding fabric through a sewing machine
Garment workers at long rows of sewing stations

1. Labour intensive manufacturing
Workers assembling wooden furniture parts

2. Bringing digitalization to highly cost competitive environments
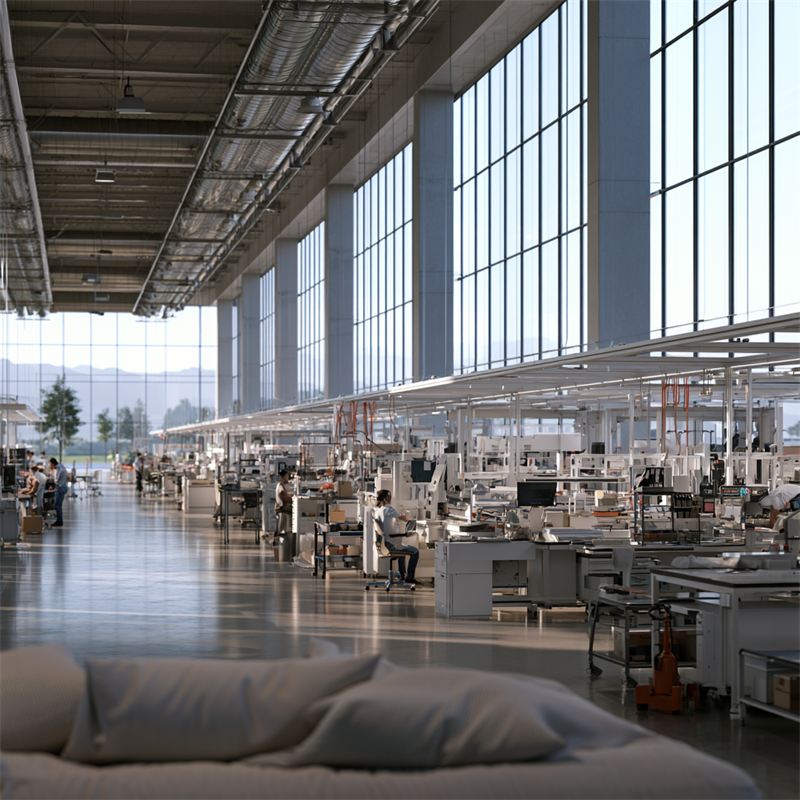
Bright modern production hall
↑ROI

3. High return on software investment
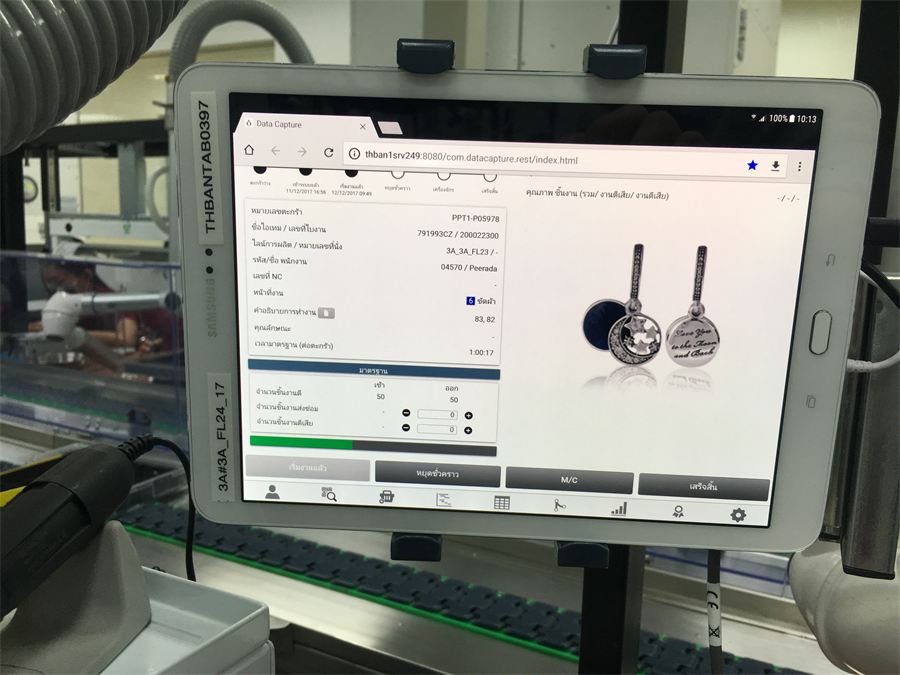
Tablet showing operator guidance mounted at a workstation

4. Simple solution, easy to use, focused on the value drivers with most business impact
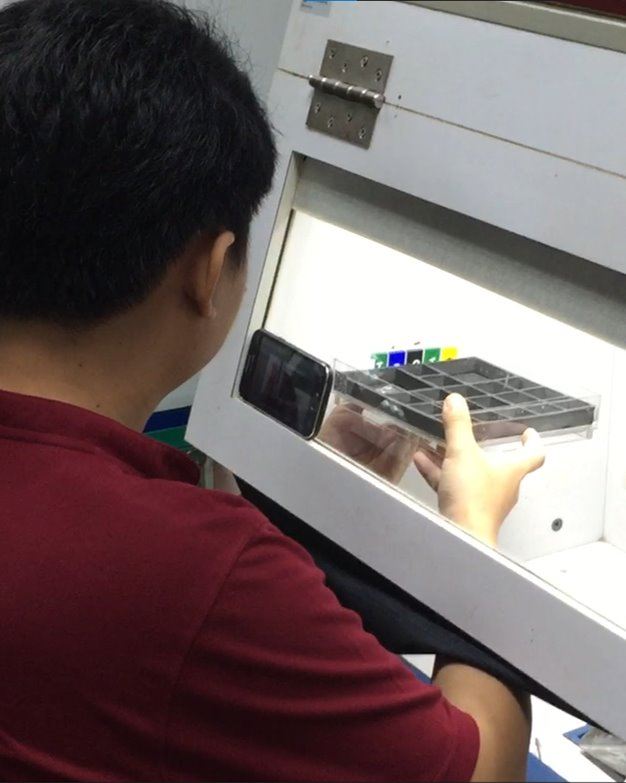
Worker scanning parts with a smartphone

5. Standard consumer devices (for workers)
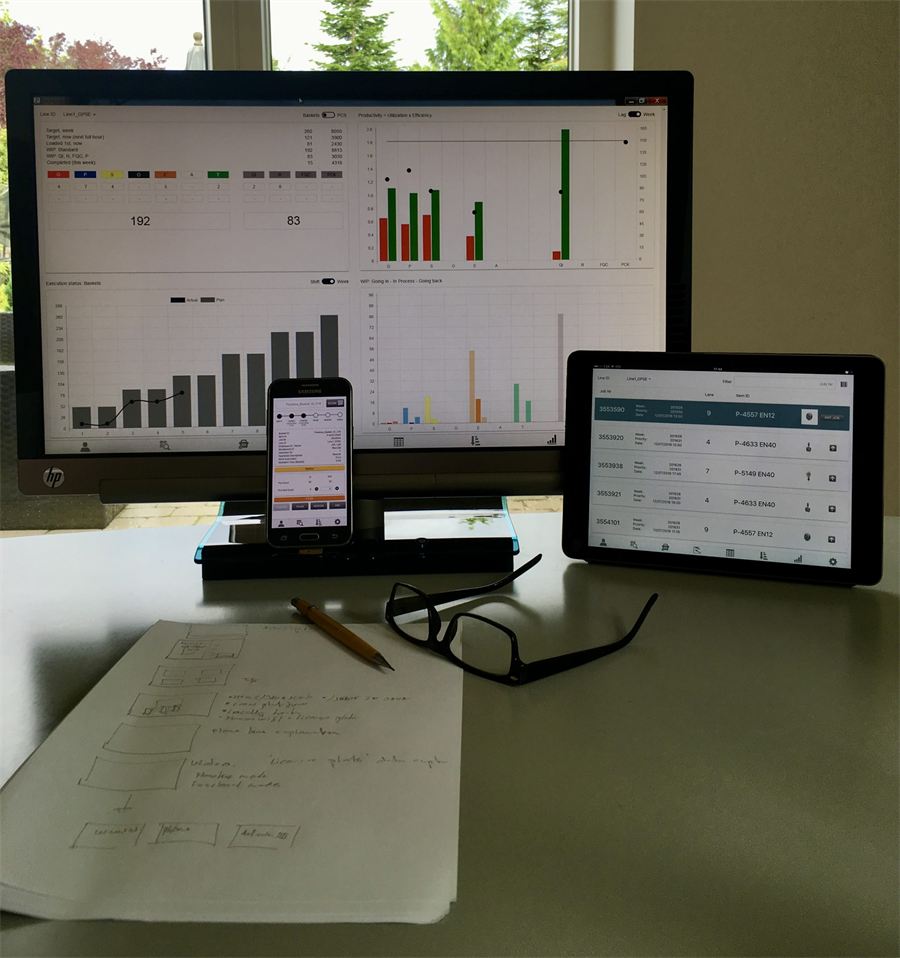
Production reports on a monitor, tablet and phone

6. Customizable report platform based on Excel templates

Microsoft Dynamics
SAP
Integration
Manual data load

7. Integration to ERP systems (Microsoft Dynamics, SAP, …) or manual management

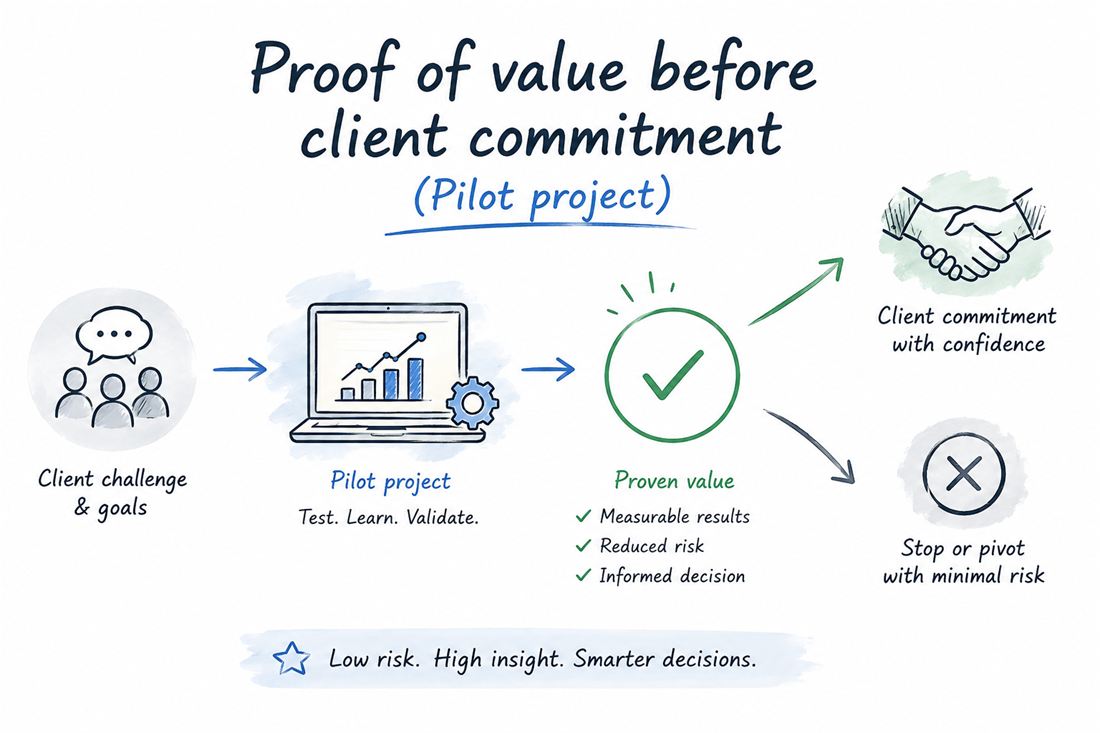
Sketch: client challenge, pilot project, proven value, commitment

8. Proof of value before client commitment (pilot project)

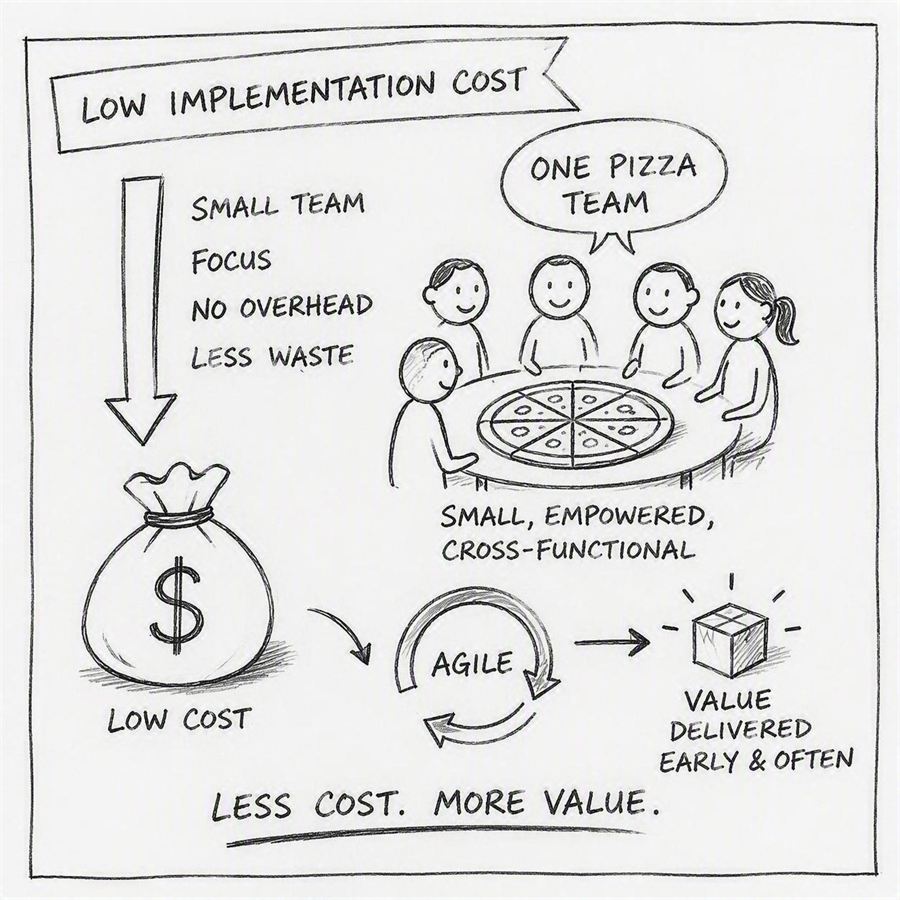
Sketch: small empowered team, low cost, value delivered early and often

9. Low implementation cost

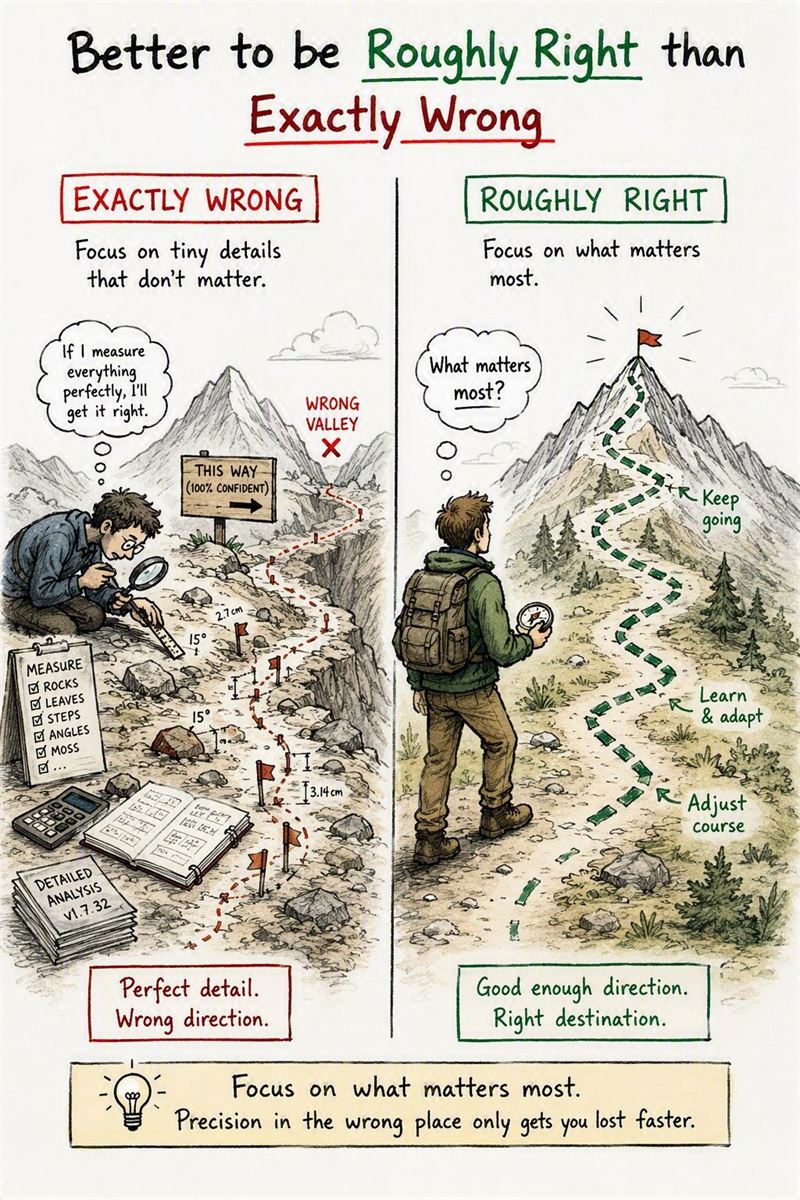
Illustration contrasting exactly wrong and roughly right

10. Better to be "roughly right" than "exactly wrong"

Mountain valley with a stone path in autumn

Technical Capabilities

Garment workers at long rows of sewing stations

Production SchedulingFlow Optimizer (APS)

Workers assembling wooden furniture parts

Enables

  • Master Production Schedule (FG, SFG planning) with 10 week horizon in daily buckets
  • Planning for flow – balancing resource utilization while optimizing on-time fill rate
  • Identification of bottlenecks and planning of overtime
  • Capacity constraints on 1) people skills and 2) seats/machines
  • Material constraints (RM, SFG inventory and purchased materials)
  • Scenario planning and fast "what-if" simulations
  • Validation of input data
  • Sales order and/or production order prioritization
  • Preferences: work assigned to the most qualified machine/worker

Scale

  • Handles large amounts of orders and resources
  • Multilevel BOM
  • Fast calculations, reduced time for planning

IT setup

  • Cloud solution
  • Customizable user interface
  • Multi-user solution
  • Customizable report platform based on Excel templates

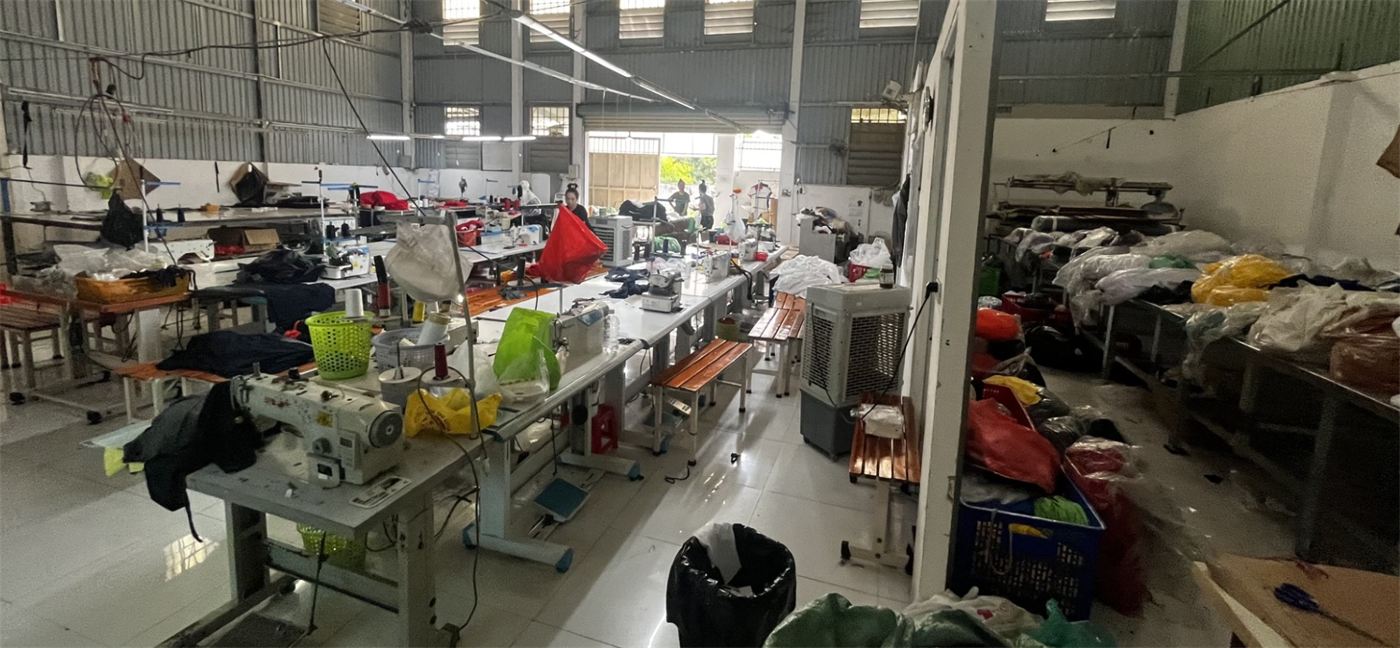
Garment workshop with sewing machines and material bins

Production ExecutionFlow Manager (MES)

Sewing cells with live production dashboards on the wall

Shopfloor worker

  • Record actual time for each operation step and display standard time expectations
  • Digital work instructions and operator guidance on the individual worker device
  • Paperless production: registration and display of all production related information
  • Material flow management: know the location/seat of each "container" in production

Shopfloor visualization

  • Online monitors revealing bottlenecks, pace and progress
  • Quality management and non-conformance tracking – create rework routes on the fly, with immediate quality feedback
  • Customizable, real-time shopfloor visualization (Grafana)

Analytics

  • Detailed worker performance and management information: KPIs, plan compliance, skill level and training needs
  • Production status, lead time analysis and quality analysis

IT setup

  • License plate system based on barcodes, QR codes or NFC
  • Fail-over solution
  • Cloud-based software platform – in the cloud or on premise
  • Integration to ERP systems (Microsoft Dynamics, SAP, …) or manual data load
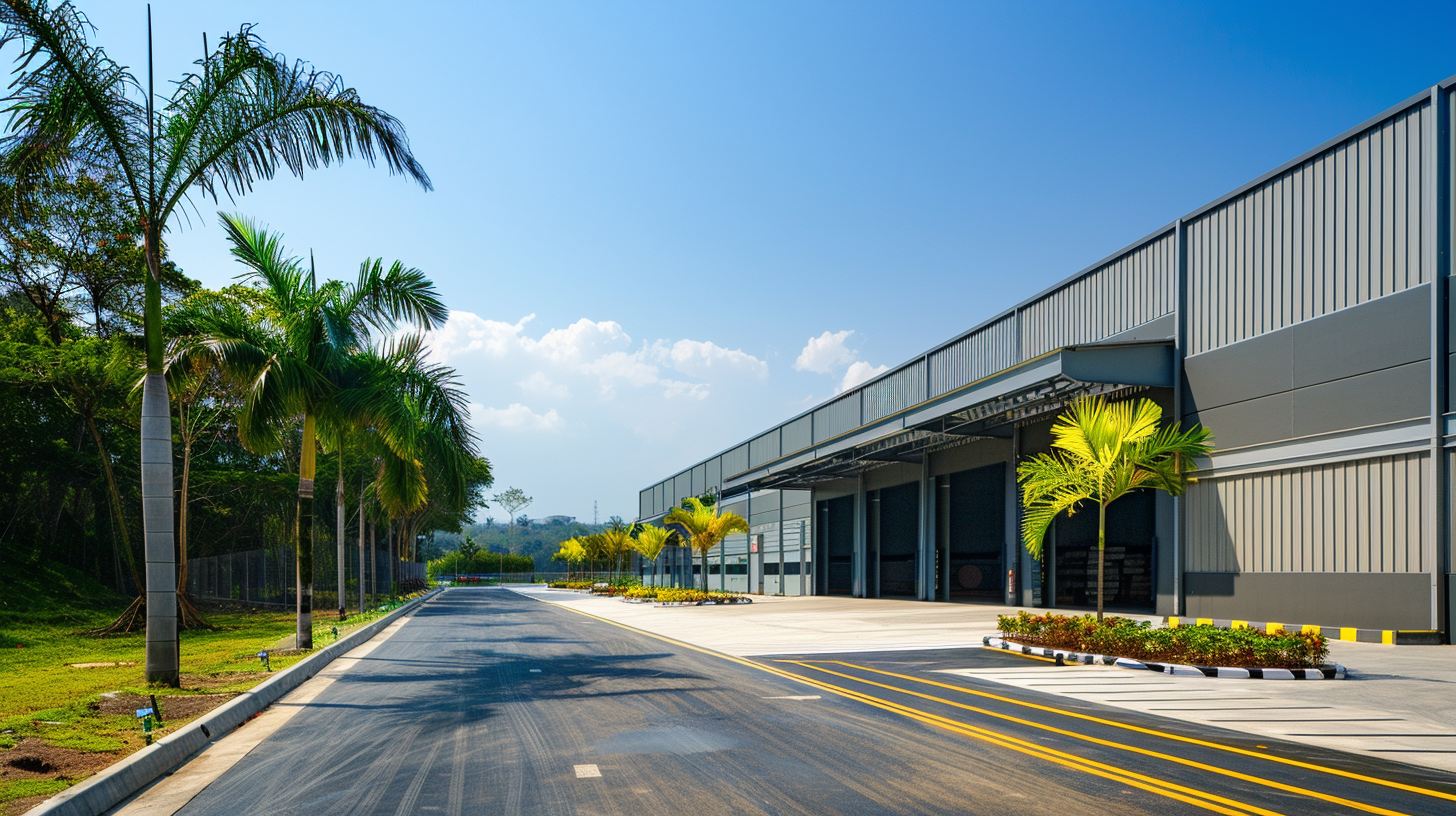
Modern factory building alongside a palm-lined road

Implementation Approach

Structured path to value with proof of concept before full commitment
Step 1

Pre-study

Step 2

Proof of concept project

Step 3

Full scale implementation

Step 4

Operation

2-3 days
  • Assessment of expected value
  • Assessment of implementation efforts
  • Identification of pilot project area
1-3 months
  • Pilot installation
  • Hardware & software provided by GATEWAY on lending basis
  • Team from client participates and owns
1 month
  • Integration to ERP or manual setup
  • Train the trainer
  • Documentation
  • Deployment on cloud or local server
  • Customization of solution including reports
Ongoing
  • Harvesting value:
  • Increased productivity
  • Increased quality
  • Increased capacity
  • Reduced lead time
  • Increased customer satisfaction
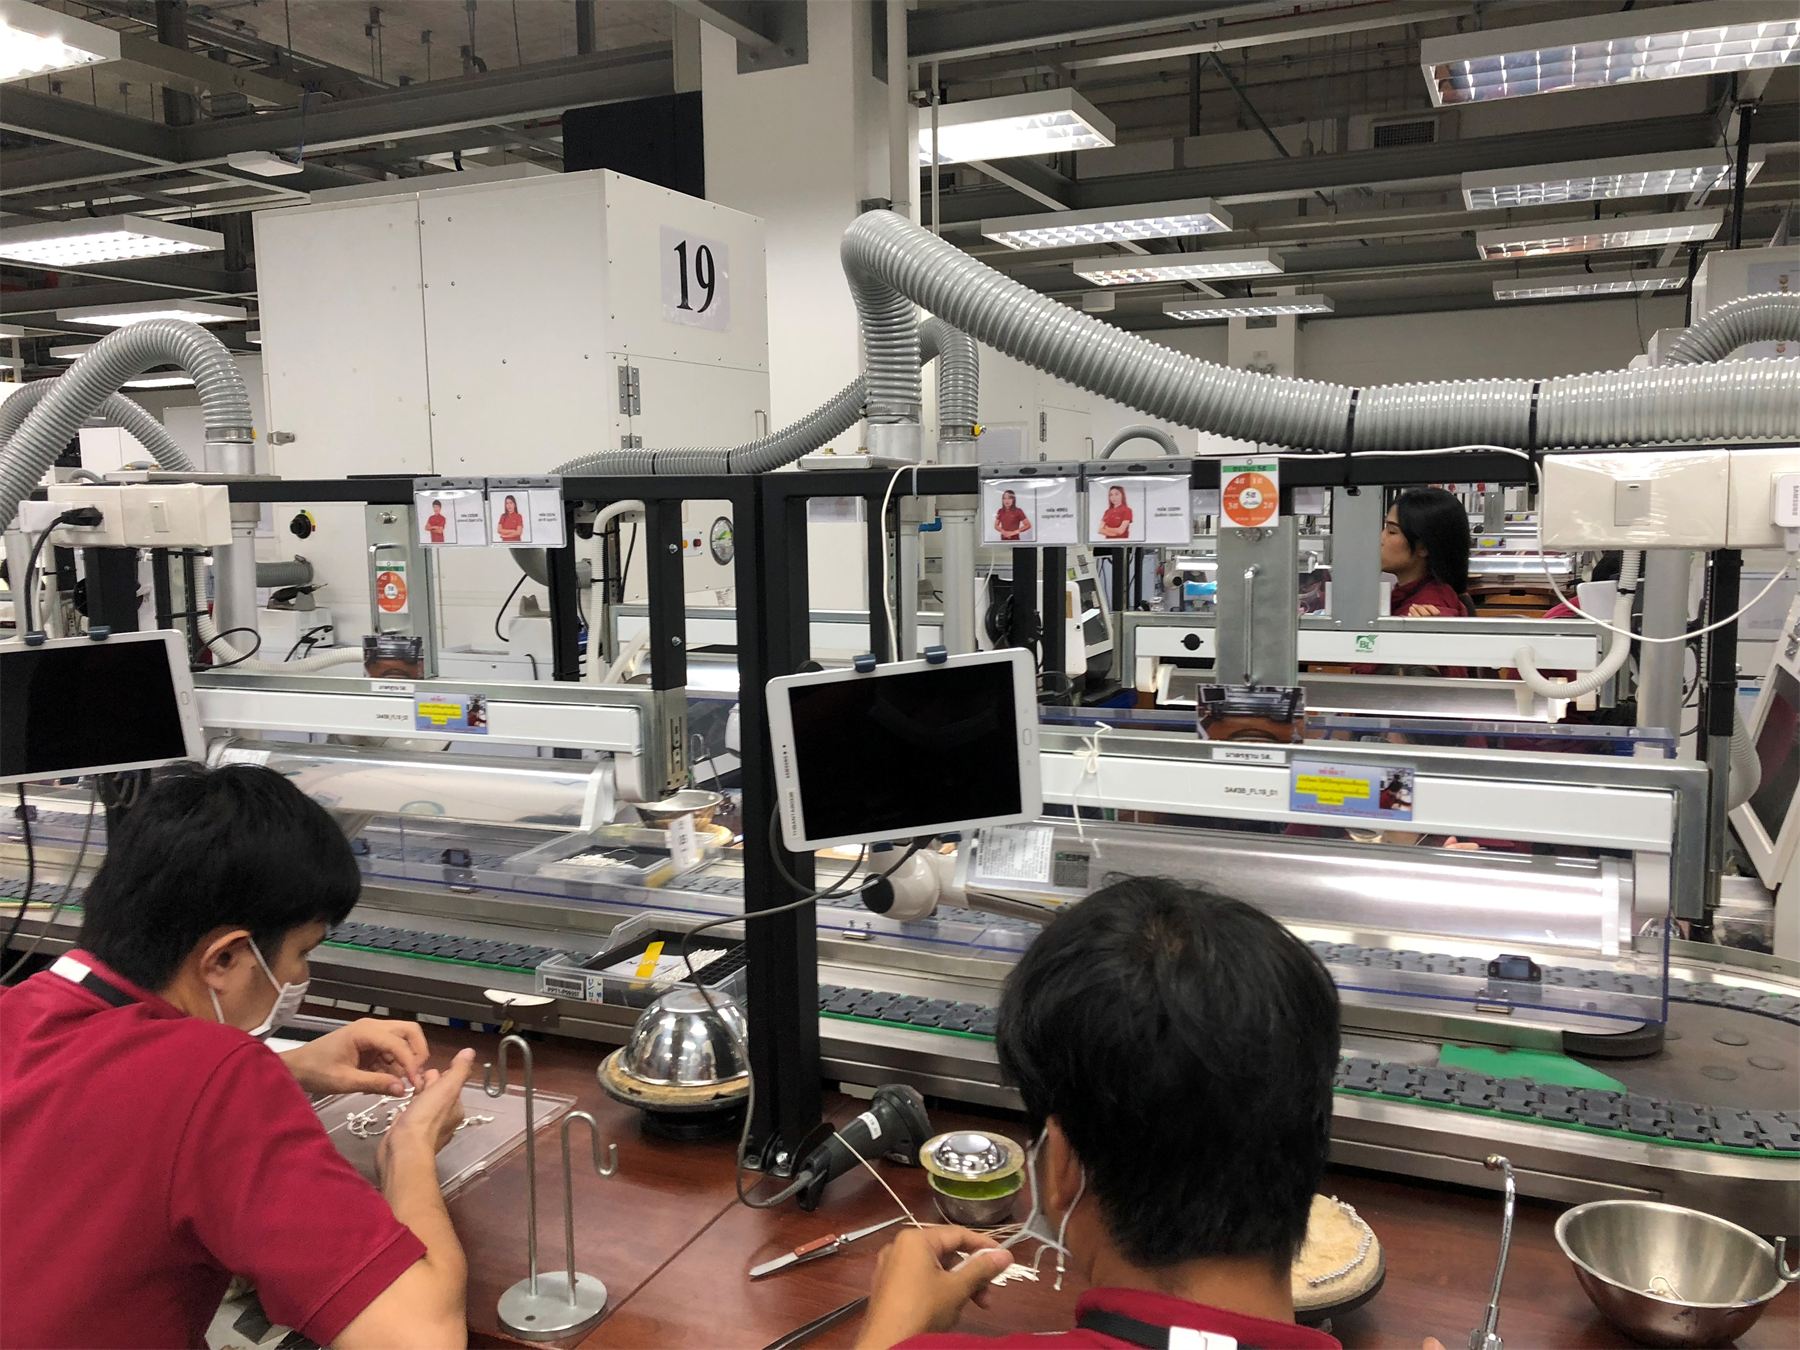
Workstations equipped with tablets for operator guidance

Start with a low-risk pilot

Hardware and software are provided on a lending basis during the proof of concept – you see the value before you commit.

Schedule Your Pre-Study
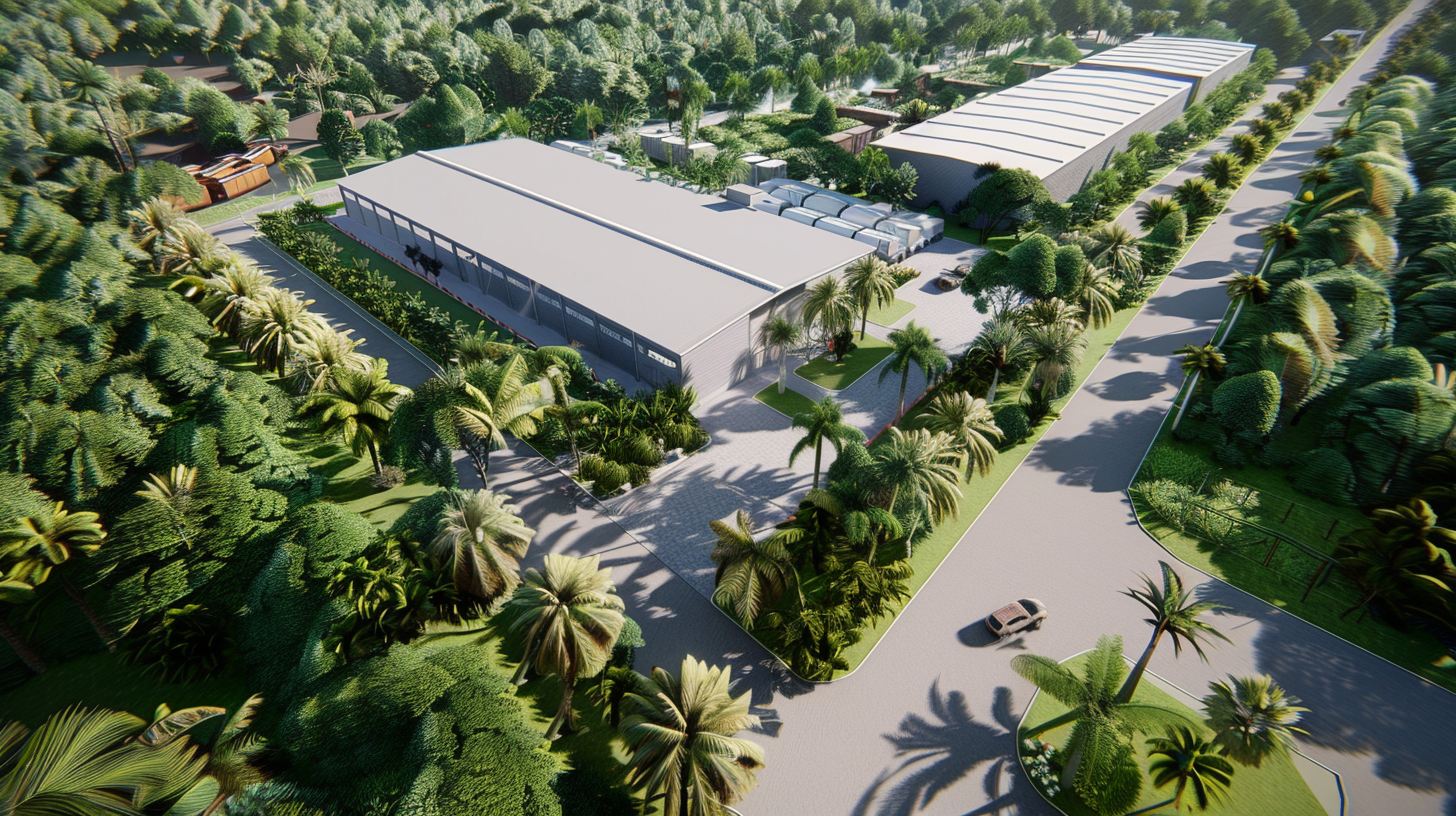
Aerial rendering of factory buildings surrounded by palm trees

Contact Information

Jens Erik Jagd Hansen

Get started today

We'll respond within 24 hours. No spam, just solutions.